Indicators · Mean reversion · scale in on stretch, scale out on stretch
EdgeMap Lite
EdgeMap Lite buys when price is stretched far below normal and sells when it's stretched far above normal, but only when two independent measures agree. A bigger stretch means a bigger trade.
What it is
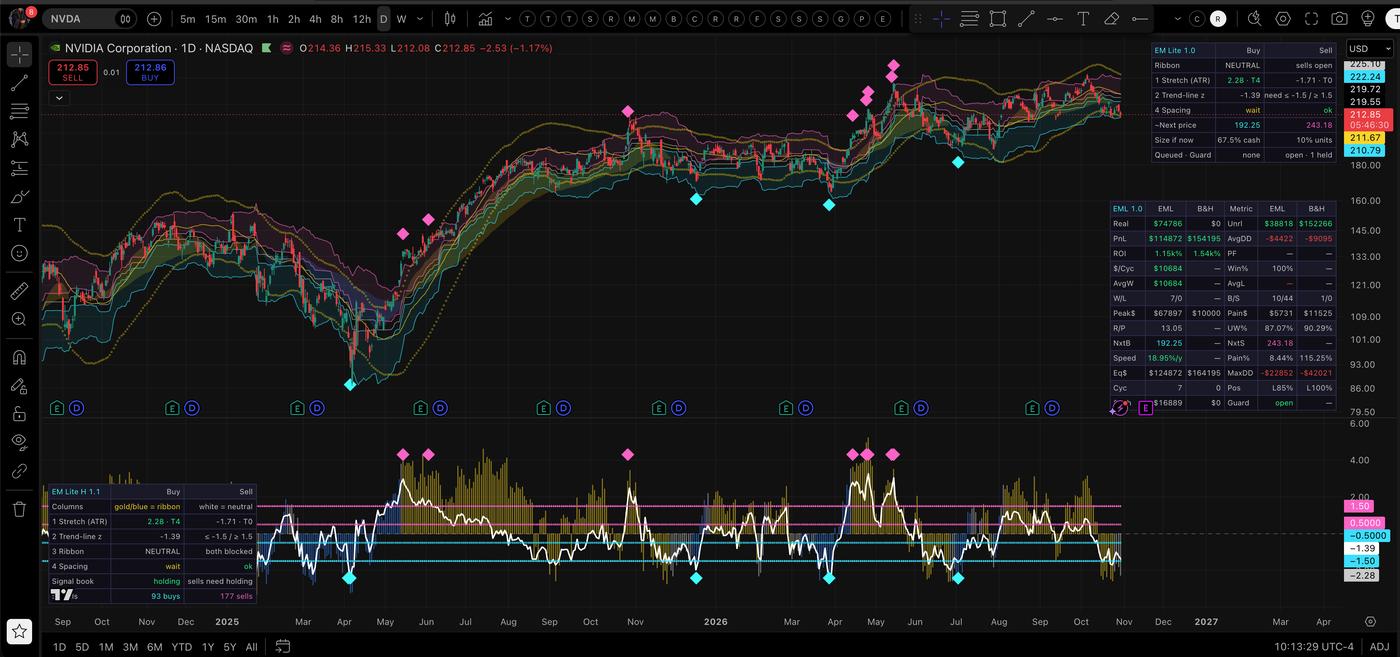
The overlay draws bands, signals and the account table on price; the EM Lite H pane shows the stretch columns and the trend-line z line, so you can see each rule pass.
Inputs and defaults
| Input | Default | What it does |
|---|---|---|
| Donchian length | 21 | Midline = middle of the prior 21 closes' high and low |
| ATR length | 14 | |
| Tier 1 depth / step / max | 0.5 ATR / 0.5 ATR / 5 | |
| Trend line | 80-bar regression, z ±1.5 | |
| Ribbon | 8 / 32 SMMA of hl2, neutral zone 0.15 ATR | |
| Spacing | Buys 0.45 ATR apart, sells 1 ATR apart | |
| Buy size | 20% of cash ×1.25 per tier, cap 50% | |
| Sell size | 10% of units ×1.5 per tier, cap 50% |
The four rules
- Stretch: the bar's low (buys) or high (sells) is at least 0.5 ATR past the 21-bar midline. Each further 0.5 ATR adds a tier, up to 5.
- Trend line: the close is at least 1.5 of its own typical misses below (buy) or above (sell) the 80-bar regression line.
- Direction: buys only in a blue (bearish) ribbon, sells only in a gold one. A neutral ribbon blocks both.
- Spacing: the next buy must be 0.45 ATR below the last buy; the next sell 1 ATR above the last sell.
Trend hold: while the gold ribbon is rising, sells stay at the 10% base. Basis guard: no sells below average cost minus 1%. Decisions are made at the close and filled at the next open, with costs of 5 + 5 bp.
Reading the chart
- Markers below the bar are buys; markers above are sells.
- Pane columns: how far the bar stretched past the midline in ATR, colored by the ribbon. White line: trend-line z. Dashed levels mark tier 1 and the z thresholds.
- The status table shows each rule's buy and sell status, the next buy and sell price, and the size if a signal fired now.
Levels and distance
On Daily reads, "buy zone" and "sell zone" are the prices where the stretch rule would qualify, with their % distance from the close. A signal also needs the trend-line and ribbon rules.
Where it appears on MystTrades
EdgeMap Lite is the third read on Daily reads (ribbon state and the buy and sell zones).
Tested results and limits
| NVDA daily, $10k start | EdgeMap Lite | Buy & hold |
|---|---|---|
| Profit | $114,872 | $154,195 |
| Max drawdown | −$22,852 | −$42,021 |
| Closed cycles won / lost | 7 / 0 | – |
| Signal book | 93 buys / 177 sells | – |
Backtest figures are from the indicator's own table on an NVDA daily chart (Oct 29, 2026). They are hypothetical, include the script's cost assumptions, depend on the start date, and are not a forecast or advice.
Because it scales out into strength, it usually trails buy and hold in a strong trend.
Alerts
Set one alert per chart. In TradingView open the alert dialog, set Condition to EdgeMap Lite, choose Any alert() function call, and pick Once per bar close if offered. That single alert covers every event below; you don’t need a separate alert for each signal. Events fire on the confirmed close and describe an action for the next open.
- Buy: a buy tranche at the close, filled at the next open.
- Sell: a sell tranche at the close, unless the Basis Guard holds it.
Version
EdgeMap Lite 1.1 (with build notes for 1.0).
Nightly refresh and version
The site recomputes every read from end-of-day data each night after the close. Versions described here: EdgeMap Lite 1.1 · EM Lite H 1.1.
Research only, not investment advice. This page describes how the indicator works in plain English; it does not publish the source. All results shown are hypothetical.