 MystTradesEvening Desk
Ask MystTrades Anything
ShadowBook, Scan Board and daily-read signals, markets and briefings in one place.
FREE · RULES-BASED · UPDATED EVERY EVENING
MystTrades publishes what a handful of rules-based trading systems say about roughly 30 stocks and cryptocurrencies, refreshed after each US market close. No opinions, no picks and nothing for sale: just the rules, their current reads and the prices where they would change their minds.
EXPLORE
For you · crypto
Watch
Latest news
Watchlist
Live data from CoinGecko, DefiLlama and Alternative.me, refreshed every 5 minutes while this page is open. The briefing is written from that data by fixed rules. Not investment advice.
About
About MystTrades
MystTrades is free, rules-based market research. Every evening after the US market close it shows what a few rules-based trading systems say about a list of stocks and cryptocurrencies, and the prices where each system would change its mind. It is built by an independent developer of TradingView indicators at TheurgyLabs.
What you will find here
- End-of-day board: every stock on the board, scored by the ShadowBook rules after each close. In or out, the trigger price that would change it, and a momentum rank.
- Daily reads: three trend systems (TriEMA, Plumbline and EdgeMap Lite) on the daily chart for 23 stocks and crypto, with their turning-point prices.
- 22-stock scan: where one trend system and two mean-reversion systems agree or disagree.
- How ShadowBook works: a plain-language guide to the rules behind the board.
When it updates
The end-of-day board refreshes after the US close, from about 4:30 pm Eastern on trading days, and the momentum rank follows it. The daily reads and the scan are based on daily closing bars. Every page shows the date of the close it is based on.
How the momentum rank works
Each board stock gets a score: 40% of its 3-month return plus 20% each of its 6-, 9- and 12-month returns. The stocks are ranked against each other, so 1 is the strongest on the board, not in the whole market.
What this is not
This is research, not investment advice. Nothing here is a recommendation to buy or sell anything, there is no trading service, and nothing is for sale. The systems follow fixed rules and they are often wrong; how a rule did in the past says nothing certain about the future. Do your own research and talk to a licensed professional before you invest.
Charts and widgets by TradingView. Prices can be delayed.
ShadowBook · end of day
17-symbol board
| SYMBOL | STATUS | PRICE | EXT. HRS | TRIGGER | DIST % | MOM RANK | FRAMEWORK | CHANGED TODAY |
|---|
ShadowBook · how it works
ShadowBook Scanner 1.1.5 engine ShadowBook 2.1 · daily bars
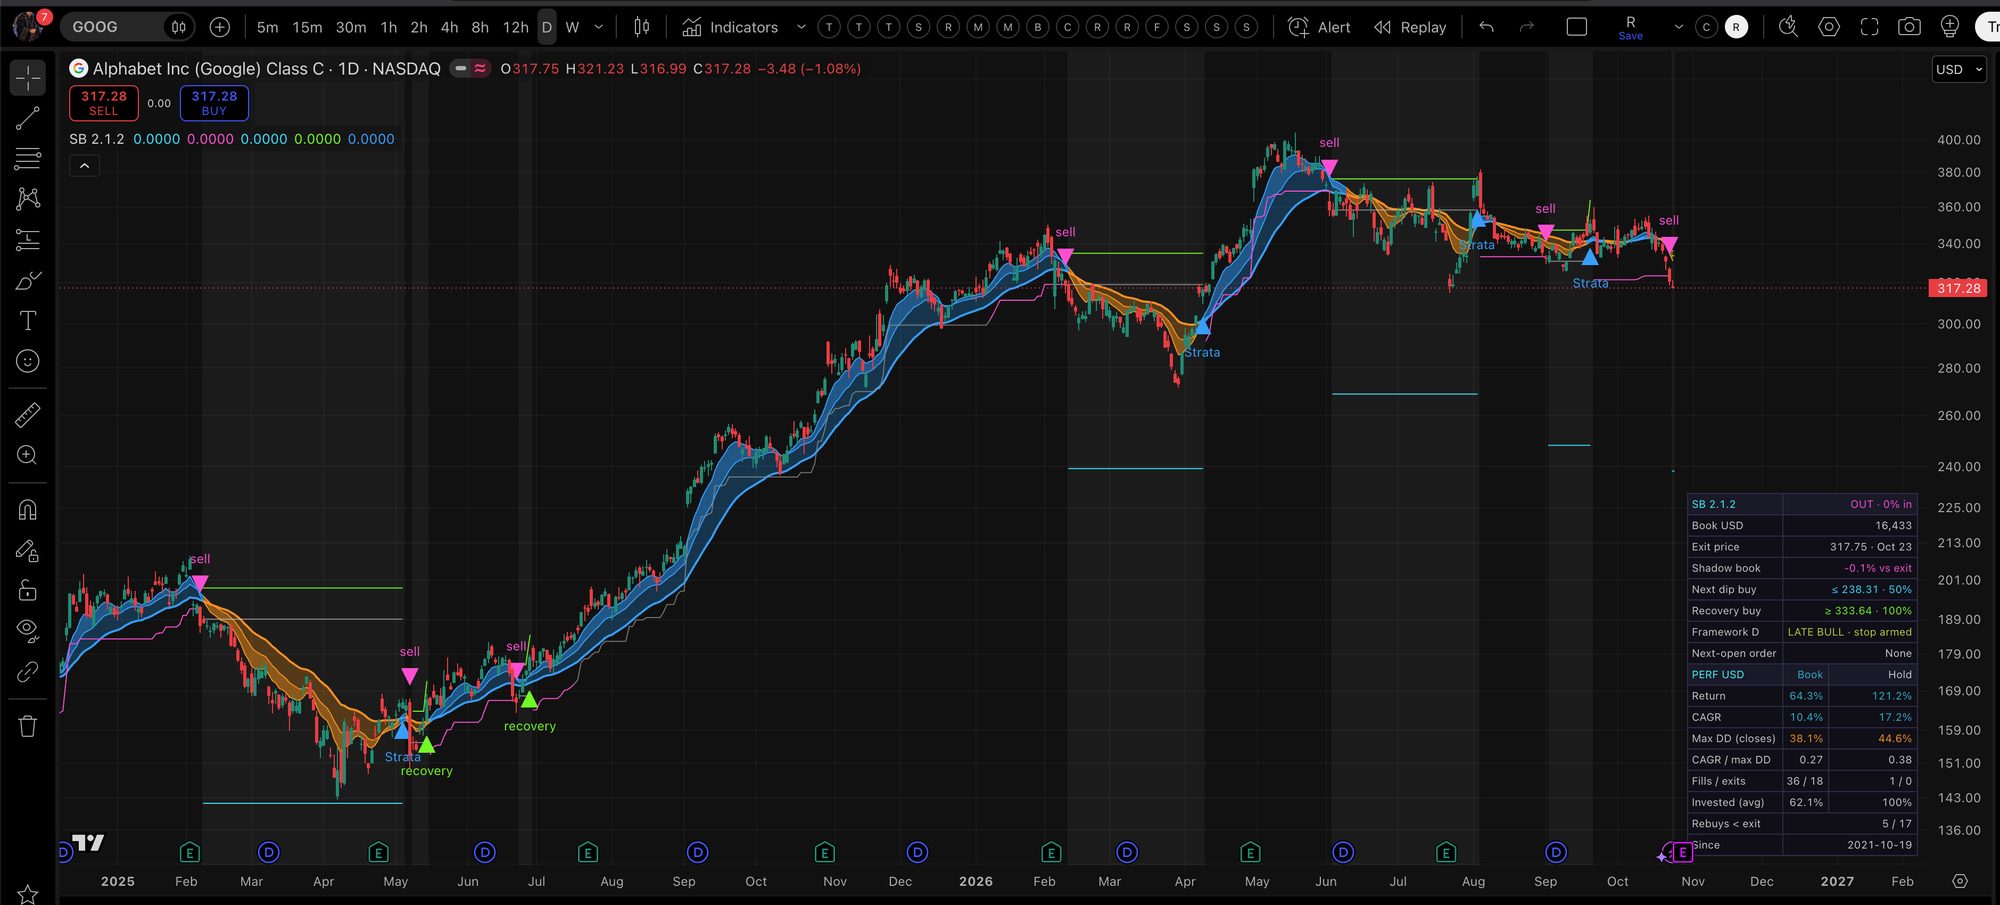
What the overlay draws:
- Strata cloud: EMA 8/16/32, blue in an uptrend and orange in a downtrend (gray before it is measured).
- Sell line: pink while the stop is armed, gray while the Framework gate holds it off. It steps up as the book's peak rises.
- While OUT: a light-gray line at the exit price, a cyan line at the next dip buy and a green line at the next recovery buy.
- Markers visible here: pink ▼ sell (book stop hit), blue ▲ Strata (a new Strata buy while OUT, re-entering with all cash) and green ▲ recovery. Other markers: cyan ◆ entry (the first Strata buy) and cyan ▲ dip buy.
- Light gray shading while the book is out of the market.
What it is
ShadowBook is a rules-only trading book run separately on each stock's daily bars. It buys on a Strata trend flip, protects the gains with a trailing stop on the value of the whole book (not on the price), and after a sale keeps a "shadow" of the exit price to buy back either on a deeper dip or on a recovery above the exit. A trend gate (the daily Framework phase) stops the book from being shaken out early in a strong uptrend.
The Scanner pane runs the same ShadowBook 2.1 rules for 16 symbols at once (one daily request per symbol), each on its own history, and shows the state, the order for the next open, the trigger levels and how far price is from them. With Closed bars (the default and the tested mode) every reading comes from the last finished daily bar; the optional Live bar reading treats the current price as if today closed there and settles at the close.
The 16 symbols, Custom vs Generic
Slots 1–5 are the shortlist (the names that passed the ShadowBook tests) and get their own total row; slots 6–16 are on watch.
1 MSTR*2 TSLA3 AMD4 GLW5 PLTR6 NVDA7 AVGO8 MU9 MRVL10 TSM11 GOOG12 AMZN13 COIN14 HOOD15 BE16 META
Each slot uses either Generic (the tested 2.1 defaults) or Custom settings. Only MSTR (*) is Custom, with the monthly-refit pick "MSTR · Sep 2026" (to be updated after each month-end refit).
| Setting | Generic | Custom (MSTR) |
|---|---|---|
| Sell when the book closes this far below its peak | 7.5% | 5% |
| Share of the shares sold | 100% | 100% |
| First dip buy: below the exit price | 25% | 20% |
| Each further dip buy: another step lower | 5% | 5% |
| Each dip buy: share of the book | 50% | 25% |
| Recovery buy: above the exit price (per step) | 5% | 5% |
| Recovery buy: share of the book | 100% | 100% |
| A new Strata buy re-enters with all cash | yes | yes |
Strata buy signal
The Strata 0.13 cloud (factory settings) uses three EMAs of the close, 8, 16 and 32, and a noise band σ = standard deviation of (close − EMA16) over 34 bars. It is warm from bar 34 once σ exists.
- Regime turns up (blue) when EMA8 − EMA32 > 0.1 × σ.
- Regime turns down (orange) when EMA8 − EMA32 < −0.1 × σ.
- Inside the ±0.1σ band the regime keeps its last value, which filters out small crossings.
A Strata buy is the bar where the regime flips from down to up (on two consecutive warm bars). That is the only way a book starts, and while OUT it re-enters with all cash.
Framework phases (the sell gate)
The phase part of the Framework 0.2 engine, computed on daily bars:
- Strength = (EMA48 − EMA148) / ATR14. Both EMAs start from the first close; ATR14 is Wilder's average of true range, seeded with a 14-bar simple average.
- From NEUTRAL a bull trend starts when strength ≥ +0.5, a bear trend when strength ≤ −0.5.
- A bull trend ends (back to NEUTRAL) when strength falls to 0 or below; a bear trend ends when it rises to 0 or above.
- Inside a trend, by age in bars: EARLY for the first 30 bars; LATE once the age passes the typical length or the half-peak rule fires; MID otherwise.
- Typical length = the median length of finished trends of the same direction that ended on or after the Start date (1 Jan 2021). Until there are 3 such trends it is 120 days.
- Half-peak rule: once the trend's peak strength has reached at least 1.0, a fall to half the peak or less latches the trend as LATE; a new peak clears the latch.
Gate: the book stop may sell only when the daily phase is not EARLY BULL or MID BULL. In those two phases the stop is "held"; in LATE BULL, NEUTRAL and every bear phase it is armed. (The gate can be switched Off in the settings; Framework is the 2.1 default.)
The site's board and the scanner use the phase only; the Framework strength percentiles are not part of the gate.
The book
- Each symbol starts with $10,000 in cash and waits for the first Strata buy on or after 1 Jan 2021.
- Costs per side: 5 bps commission + 5 bps slippage. Buys fill at open × 1.0005 and pay the commission on top; sells fill at open × 0.9995 less the commission.
- Decide at the close, fill at the next open. Every order is queued by a daily close and filled at the following session's open.
- "Hold" is buy-and-hold from the same first entry fill, the benchmark for the book. Max drawdowns are measured on closing values.
States: WAIT, IN, OUT
- WAIT: all cash, before the first Strata buy. Its only trigger is a Strata buy.
- IN: invested; the trailing book stop is watching. "IN 80%" means 80% of the book is in shares.
- OUT: sold by the stop, waiting to buy back; it remembers the exit price. "OUT 50%" means part of the book has already been bought back. When cash drops below 10% of the book it counts as IN again, and the book peak restarts from that value.
Sell line and trailing drawdown
While IN, the book's peak closing value is tracked (reset at each entry). At each close, if the book value is at or below peak × (1 − X) (X = 7.5% Generic, 5% MSTR) and the gate is armed, a sale of 100% of the shares is queued for the next open.
The sell line turns that into a price: sell line = (peak × (1 − X) − cash) / shares, the close at which the book would hit its stop. A close at or below it sells (if armed).
Bull-phase sell block: in EARLY or MID BULL the stop is held, so price can close under the sell line without a sale; the board shows "held". It arms when the phase becomes LATE (age past the typical length, or the half-peak fade) or the trend ends. The scanner's "≤Nd" counts the latest day that happens if the trend keeps running.
Dip ladder and recovery buys
While OUT, each close is checked against the exit price (the open at which the stop sold):
- Dip ladder: step k is at exit × (1 − (D1 + k × step)). Generic: 25%, 30%, 35% … below the exit; MSTR: 20%, 25%, 30% …. Each step a close reaches adds a buy of 50% of the book (MSTR 25%).
- Recovery: step k is at exit × (1 + 5% × (k + 1)), i.e. 5%, 10%, 15% … above the exit. Each step reached adds a buy of 100% of the book.
- A new Strata buy re-enters with all remaining cash.
Several steps can trigger on one close; they stop adding once the total reaches the cash available. The buy (capped at the cash) is queued for the next open, and the used steps are remembered, so the next levels move one step further.
The SB 2.1 status panel
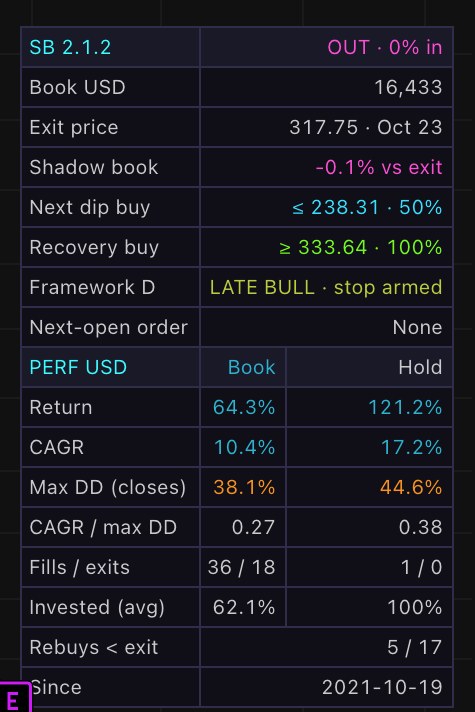
Every value is taken at the last scored close. A fill at the next open is booked when that bar closes. The rows below are for an OUT book, as in the GOOG daily screenshot (23 Oct 2026).
- Title row: SB 2.1.2 · OUT · 0% in. The state and the share of the book in shares (shares × last close ÷ book). WAIT reads "WAIT for Strata buy". An invested book reads "HOLD · fully in" (99.5% or more) or "HOLD · n% in".
- Book USD 16,433: cash + shares × close. When HOLD it also shows how far the book is below its peak close, e.g. "(−3.1%)".
- Exit price 317.75 · Oct 23: the open at which the stop sold. Every buy-back level is measured from it.
- Shadow book −0.1% vs exit: last close ÷ exit price − 1, i.e. how the position would have done if it had been kept.
- Next dip buy ≤ 238.31 · 50%: exit × (1 − (25% + 5% × dip buys already used)). With none used that is 317.75 × 0.75 = 238.31. A close at or below it buys 50% of the book at the next open. It shows "off" when dips are disabled or no cash is left.
- Recovery buy ≥ 333.64 · 100%: exit × (1 + 5% × (recovery buys used + 1)) = 317.75 × 1.05 = 333.64. A close at or above it buys 100% of the book.
- Framework D · LATE BULL · stop armed: the daily Framework phase and the gate: "stop armed", "stop held off" (EARLY/MID BULL) or "gate off". On a daily chart it uses that bar's phase; on other timeframes, the last completed day's phase.
- Next-open order · None: decided at the last close: "Sell 100%", "Buy amount" or "None".
When the book is HOLD (invested), rows 2–5 change to: Sell if close ≤ (the sell line, with "(−7.5%)" and "· held" when the gate holds it off), Peak book, Strata cloud (blue / orange / not measured) and Buy-backs (the settings summary, e.g. "−25%/+5%/Strata").
PERF USD (Book vs Hold). "Hold" buys at the same entry fill, with the same costs, and never sells.
- Return 64.3% / 121.2%: value ÷ $10,000 − 1.
- CAGR 10.4% / 17.2%: (value ÷ $10,000)1/years − 1. Years run from the entry bar to the last scored close, at 365.25 days each.
- Max DD (closes) 38.1% / 44.6%: the largest fall of the closing value from its highest close.
- CAGR / max DD 0.27 / 0.38: CAGR ÷ max drawdown (10.4 ÷ 38.1 ≈ 0.27).
- Fills / exits 36 / 18 vs 1 / 0. Fills counts every filled order: the first entry, each stop sale and each buy-back. Exits counts the stop sales. Hold is always 1 fill and 0 exits.
- Invested (avg) 62.1% / 100%: the average, over every bar since the entry, of shares × close ÷ book at that close. Hold is 100%.
- Rebuys < exit 5 / 17: buy-back fills whose open was below the exit open they followed, out of all buy-back fills (compared before slippage). Here 5 of 17 buy-backs were cheaper than the sale.
- Since 2021-10-19: the end row reads "Since" on a daily chart. "⚠ daily only" replaces it when the chart is not 1D, because the rules were tested on daily bars. "since" is the date of the entry, the first Strata buy on or after the 1 Jan 2021 start. The cell's tooltip also shows the fees and slippage paid.
Overlay settings (defaults): Strata EMA 8/16/32, residual volatility 34 bars, noise suppression Low (0.1σ; Medium 0.25, High 0.5); stop 7.5% below the peak book, sell 100% of the shares; Framework gate on; dip buys on (25% then every 5% lower, 50% of the book each); recovery buys on (5% steps, 100% of the book); Strata re-entry on; $10,000; 5 bps commission + 5 bps slippage per side; Start 1 Jan 2021, End 1 Jan 2035. Its alerts: "ShadowBook sell (next open)" and "ShadowBook buy (next open)", plus alert() messages with the amount and the reason.
Trigger and Dist
- IN: the trigger is the sell line, shown as "≤ price" ("held" when the gate is holding the stop off). Dist is from the price to the sell line.
- OUT: the trigger is the next dip level (≤) and the next recovery level (≥); Dist is the distance to the nearer one, negative below the price, positive above.
- WAIT: the trigger is a Strata buy (no price level).
Alerts
One combined message per daily close, for all 16 slots (create one TradingView alert with "Any alert() function call"). It can contain:
- Order queued: "TICKER SELL 100% at the next open" or "TICKER BUY n% of the book at the next open".
- Framework change: "TICKER framework MID BULL -> LATE BULL".
- Near trigger: once when the distance to the nearest trigger first comes within 5% (slot 1, MSTR) or 3% (slots 2–16), and once more within 1%. It re-arms after price moves back out or the state changes. For IN names the distance counts 0 once price is through the sell line.
How to read the board
The End-of-day board shows the 17 symbols at the last close:
- STATUS: IN or OUT.
- PRICE: that day's close.
- TRIGGER: the sell line for IN names; the nearer buy-back level for OUT names.
- DIST %: (trigger − price) / price. It shows 0 for an IN name whose sell line is above the price (the stop is being held off in EARLY/MID BULL).
- FRAMEWORK: the daily phase.
- CHANGED TODAY: compared with the previous session: "Sold at open" / "Bought at open", "BUY/SELL queued for next open", or "Framework A → B".
Filters: All, IN, OUT, Near trigger <3%, Changed today. Column headers sort.
Nightly refresh
After the US close (from 4:30 pm ET on trading days) a script recomputes every symbol with a Python port of the scanner's rules on daily bars, Closed-bar reading, the same as the TradingView pane on its default setting. It checks that every symbol has the same last bar date and a valid IN/OUT state, compares with the previous session for "changed today", then replaces only the board's data on this site and verifies that the live page shows the new date. If any check fails, the board is left as it was. The board therefore always shows the decision made at the last close, for the next open.
Rules-based research tool, not investment advice.
Scan Board · daily bars · TriEMA trend + GLYPH and TFlow mean reversion
22-stock scan
Where the three scans point
One tile per stock. The three bars are TriEMA, GLYPH and TFlow, left to right. Tiles are sorted so the strongest agreement comes first. The filter buttons above apply here too. Buy or sell means that scan's own signal fired in the last 3 bars; close means its readiness is 70 or more on that side.
Buy (signal fired)Close to a buyNeutralClose to a sellSell (signal fired)Warming up
| # | SYMBOL | AGREEMENT | TRIEMA | GLYPH | TFLOW | NEW / CHANGED |
|---|---|---|---|---|---|---|
| 1 | NVDA | Mean reversion leans buy, TriEMA waits | FLAT 97 | BUY | QUIET | TFlow buy → quiet |
| 2 | AMD | Mean reversion leans buy, TriEMA waits | FLAT 8 | QUIET | BUY | TFlow buy B✓ (1) |
| 3 | AVGO | Mean reversion leans buy, TriEMA waits | FLAT 99 | BUY | BUY | GLYPH buy B✓ (0); TFlow buy B✓ (1) |
| 4 | MRVL | Quiet | FLAT 8 | QUIET | QUIET | agreement: MR buy, T waits → Quiet; TFlow buy → quiet |
| 5 | MU | Mean reversion leans buy, TriEMA waits | FLAT 13 | BUY | BUY | GLYPH buy B✓ (0); TFlow buy B✓ (1) |
| 6 | ALAB | Mean reversion leans buy, TriEMA waits | FLAT 73 | BUY | BUY | TFlow buy B✓ (0) |
| 7 | ISRG | Fight: MR sell, TriEMA holds trend | LONG 12 | SELL | SELL | agreement: Quiet → Fight; GLYPH quiet → sell; TFlow quiet → sell |
| 8 | MSTR | TriEMA only, both mean-reversion scans quiet | LONG 48 | QUIET | QUIET | |
| 9 | COIN | Mean reversion leans buy, TriEMA waits | FLAT 7 | QUIET | BUY | agreement: Quiet → MR buy, T waits; TFlow quiet → buy |
| 10 | HOOD | Mean reversion leans buy, TriEMA waits | FLAT 9 | BUY | BUY | agreement: Quiet → MR buy, T waits; GLYPH quiet → buy; TFlow quiet → buy |
| 11 | CRWV | Mean reversion leans buy, TriEMA waits | FLAT 13 | NA | BUY | TFlow buy B✓ (1) |
| 12 | GOOG | Mean reversion leans buy, TriEMA waits | FLAT 4 | QUIET | BUY | agreement: Quiet → MR buy, T waits; TFlow quiet → buy |
| 13 | AMZN | TriEMA only, both mean-reversion scans quiet | FLAT 3 | QUIET | QUIET | TriEMA sell → buy |
| 14 | SNDK | Mean reversion leans buy, TriEMA waits | FLAT 11 | NA | BUY | TFlow buy B✓ (1) |
| 15 | VST | Quiet | FLAT 3 | QUIET | QUIET | agreement: TriEMA only → Quiet; TriEMA sell → wait |
| 16 | BE | Mean reversion leans buy, TriEMA waits | FLAT 10 | BUY | BUY | TFlow buy B✓ (0) |
| 17 | TSLA | Quiet | LONG part 4 | QUIET | QUIET | |
| 18 | PLTR | Quiet | LONG 59 | QUIET | QUIET | |
| 19 | SMCI | Quiet | FLAT 8 | QUIET | QUIET | agreement: TriEMA only → Quiet; TriEMA buy → wait |
| 20 | GLW | Mean reversion leans buy, TriEMA waits | FLAT 73 | BUY | BUY | TFlow buy B✓ (1) |
| 21 | SPCX | Quiet | WARMUP 95b | NA | QUIET | |
| 22 | META | Mean reversion leans buy, TriEMA waits | FLAT 3 | QUIET | BUY | agreement: TriEMA only → MR buy, T waits; TriEMA sell → wait; TFlow quiet → buy |
Research only, not investment advice.
Daily reads · TriEMA, Plumbline and EdgeMap Lite · daily close
Turning points
Each card shows where each system stands and the prices where it would change its mind. Cards run from most bullish to most bearish; within a group, the one closest to a turn comes first.
CLOSEST TO A TURN
Levels are prices where a system changes state, not forecasts. TriEMA: long or flat on its trend rules; its 18-day average is the exit line when long. Plumbline: in or cash on its two-average switch, with the single close that would flip it (some are too far for one close). EdgeMap Lite: ribbon direction, plus how far price must stretch before it buys or sells; "price inside buy zone" means price is already stretched enough and EdgeMap still needs its other conditions. Arrows at a ladder edge are levels off the scale. Lean: +1 or −1 per system. Not investment advice.
Markets
Watchlist · 17 + SPCX
| # | Watchlist | Ticker | Price | Day | Ext. hrs | 7D | 30D | 90D | Market cap ↓ | Volume | P/E | Earnings | Sector | Investor read |
|---|
Markets
Macro & futures
Loading…
Markets
Heatmaps
S&P 500
Crypto
Crypto
BTC · SOL · ZEC
Bitcoin
Solana
Zcash
Research
News
Research
U.S. economic calendar
Scheduled U.S. macro releases with forecasts, prior values, impact tags and release times.
Release calendar
| Date | Event | Impact | Actual | Forecast | Previous | Change |
|---|
Briefings
Grok Bot updates
Workspace · private to your sign-in
Portfolio
Track stocks, options, crypto perps and cash. Only you can see your positions.
Your private portfolio
Sign in with your email (a one-time code is sent to you) to build a portfolio that only you can see. Prices update live from Yahoo Finance.
Sign in to build your portfolioTotal value—
Allocation
History · from daily snapshots
Stocks and options: live Yahoo Finance quotes (options by OCC symbol; if Yahoo has no quote, the last saved price is used and marked "saved"). Perps: P&L = size × (mark − entry), mark from Yahoo spot; value = margin + P&L. Highlighted options expire within 7 days.
Crypto
Bitcoin Returns
Monthly returns, quarterly returns, and average monthly BTC prices.
Bitcoin Monthly Returns
Monthly % returns since 2013. YTD column = full-year compounded return. Current month is month-to-date.
Loading…
Bitcoin Average Monthly Price
Mean daily close per month, in USD.
Loading…
Workspace