Indicators · Mean reversion · regime-aware wave oscillator
GLYPH
GLYPH reads like the popular wave-and-money-flow panes, with waves, dots and diamonds, but each piece underneath is rebuilt, and a signal is only claimed (a solid dot) when price structure and the market regime agree.
What it is
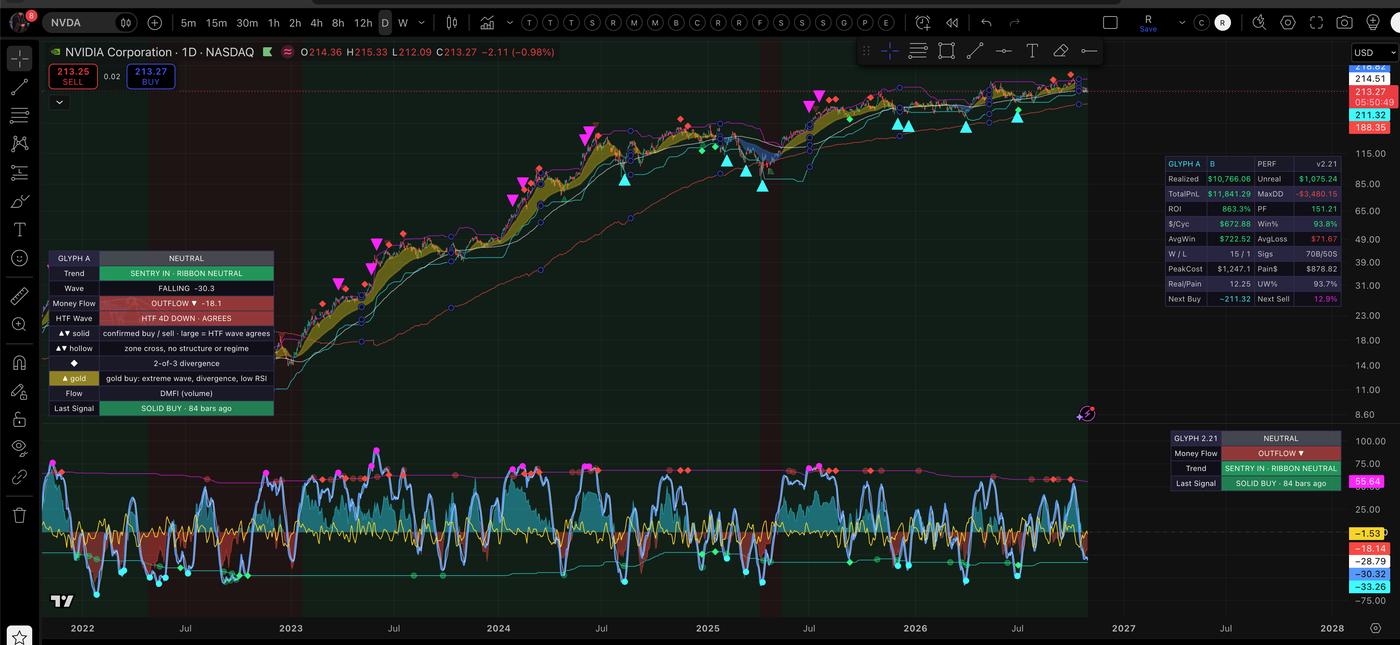
GLYPH comes as a pair: the GLYPH pane under the chart and GLYPH A, an overlay that puts the same signals on price. Both share every input and default, so they agree bar for bar. It's a mean-reversion tool: it looks for washed-out lows to buy and stretched highs to sell.
The six layers
- Waves: a WaveTrend-style channel oscillator with a fast and a signal line. Overbought and oversold zones aren't fixed numbers; they're percentiles of the oscillator's own history on that chart, so a signal means the same on a wild stock and a quiet one.
- Money flow (DMFI): 2×MFI minus the RSI of MFI, centered at zero and drawn as an area.
- Impulse: the gap between the two wave lines, an acceleration read.
- Regime-aware dots: a wave cross inside a zone is solid only when price recently touched the learned structural band and the regime allows it; otherwise it's hollow (pattern shown, signal not claimed).
- Divergence: price pivots (5 left, 3 right, at most 24 bars apart) checked against waves, DMFI and impulse. A diamond needs 2 of the 3 to agree.
- Higher-timeframe agreement: the status table shows whether the higher-timeframe wave agrees.
Signals and rules
- Solid buy: fast wave crosses up in the oversold zone and price touched the lower structural band.
- Solid sell: fast wave crosses down in the overbought zone and price touched the upper band. Sells are refused in a strong uptrend (fully stacked, rising 8/16/24/32 ribbon) unless the wave reached its 97th percentile ("Unless extreme").
- Gold buy: a solid buy with an extreme low wave, a recent 2-of-3 bullish divergence (within 12 bars) and RSI(14) at or below 35. It's a display and alert tier.
- Sentry: a daily-bar switch (100-day entry, 300-day exit with an ATR buffer) shown as a strip and tint. It is shown, not enforced, unless you turn on "Sentry gates buys."
- Solid signals wait for the bar to close.
Reading the chart
- Solid cyan ▲ / magenta ▼: confirmed buy / sell. Hollow: a zone cross that failed structure or regime.
- ◆ diamond: 2-of-3 divergence (bull below the bar, bear above). Gold ▲: gold buy.
- On price: the structural bands, the 8/16/24/32 SMMA ribbon, and the Sentry lines with a green (IN) or red (OUT) tint.
- Status table: a plain-English verdict in simple mode; pro mode shows each value against its learned zone.
Where it appears on MystTrades
GLYPH is one of the two mean-reversion columns on the 22-stock scan, with a lean (buy, sell or neutral), its last event and age, and how ready each side is.
Tested results and limits
| GLYPH A on NVDA daily | Value |
|---|---|
| ROI | 883.3% |
| Total P&L | $11,841 |
| Max drawdown | −$3,480 |
| Wins / losses | 15 / 1 |
| Win rate | 93.8% |
| Profit factor | 151.2 |
Backtest figures are from the indicator's own table on an NVDA daily chart (Oct 29, 2026). They are hypothetical, include the script's cost assumptions, depend on the start date, and are not a forecast or advice.
GLYPH scales in and out of a position; it isn't a single all-in switch, so a high win rate doesn't mean it keeps up with buy and hold in a strong trend.
Alerts
Set one alert per chart. In TradingView open the alert dialog, set Condition to GLYPH, choose Any alert() function call, and pick Once per bar close if offered. That single alert covers every event below; you don’t need a separate alert for each signal. Events fire on the confirmed close and describe an action for the next open.
- Buy and Sell: the solid signals (wave cross in the zone with structure).
- Gold buy: the extreme oversold version with recent divergence and washed-out RSI.
- Bull / bear divergence: a divergence confirmed by 2 of the 3 sources.
Version
GLYPH and GLYPH A v2.21.
Nightly refresh and version
The site recomputes every read from end-of-day data each night after the close. Versions described here: GLYPH v2.21 · GLYPH A v2.21.
Research only, not investment advice. This page describes how the indicator works in plain English; it does not publish the source. All results shown are hypothetical.