Indicators · Trend · two-EMA in-or-cash switch
Plumbline
Plumbline is the simplest system on the site: fully invested while the fast EMA is above the slow EMA, and all cash while it isn't.
What it is
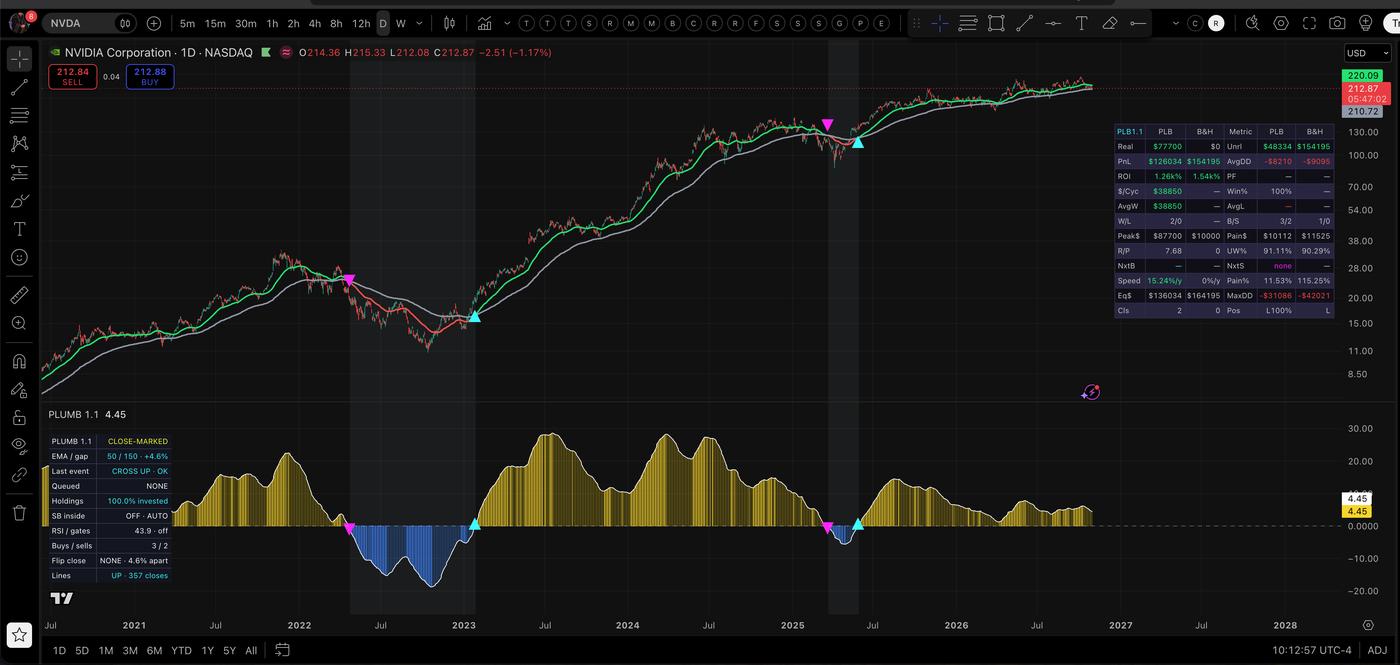
Plumbline is a slow two-average switch meant to catch the big trends and sit out the big declines. Version 1.1 is a single script. On the price chart it draws the lines, decision triangles, cash shading and one performance table; in its own pane it shows the EMA gap histogram and a status table.
Inputs and defaults
| Input | Default | What it does |
|---|---|---|
| Lengths | Auto | Stocks 50 / 150 EMA, crypto 24 / 100 |
| Starting capital | $10,000 | |
| Costs | 5 + 5 bp per side | |
| Start | Jan 1, 2021 | Invested at the start if fast was above slow |
| SpreadBias inside | Auto | On for crypto, off for stocks |
| Table style | Ralis detailed | Or Plumbline classic |
Signals and rules
- IN while the fast EMA is above the slow EMA; CASH while it's at or below. Decisions are made at the confirmed close and filled at the next open. It's long or cash only.
- SpreadBias inside (crypto by default): while IN, it trims 25% of units on sell signals (10% in a strong uptrend) and spends 50% of cash on buy turns, with cooldowns and RSI gates. CASH stays in cash.
Reading the chart
- Fast and slow EMAs on price, triangles at each switch, and shading while in cash.
- Pane: a histogram of the EMA gap, positive while IN.
- Status table: lengths and gap, last event, holdings, flip-close distance, and how many closes the lines have been up.
Levels and distance
On Daily reads, "buy above" (or "sell below") is the single closing price that would flip the switch tomorrow. When the gap is wide, that price can be far away; some are too far for one close.
Where it appears on MystTrades
Plumbline is the IN/CASH column on Daily reads, with days in the state and the flip level.
Tested results and limits
| NVDA daily, $10k start | Plumbline | Buy & hold |
|---|---|---|
| Profit | $126,034 | $154,195 |
| Max drawdown | −$31,086 | −$42,021 |
| Cycles / win rate | 2 / 100% | – |
Backtest figures are from the indicator's own table on an NVDA daily chart (Oct 29, 2026). They are hypothetical, include the script's cost assumptions, depend on the start date, and are not a forecast or advice.
Plain-switch tests: stocks at 50/150 were a median 1.18x buy and hold on 48 charts (34 beat it), but 0.81x on a 21-favorites list. Crypto at 24/100 was a median 1.56x. SpreadBias failed on stocks and passed on crypto, which is why Auto turns it on only for crypto. It's late at turns by design and whipsaws in sideways markets.
Alerts
Set one alert per chart. In TradingView open the alert dialog, set Condition to Plumbline, choose Any alert() function call, and pick Once per bar close if offered. That single alert covers every event below; you don’t need a separate alert for each signal. Events fire on the confirmed close and describe an action for the next open.
- Buy: the fast EMA closes above the slow EMA.
- Sell: the fast EMA closes below the slow EMA.
- SpreadBias add / trim: an accepted add or trim inside the uptrend.
- Each message is a small JSON line (ticker, engine, action and percentage), so it can feed a webhook.
Version
Plumbline 1.1.
Nightly refresh and version
The site recomputes every read from end-of-day data each night after the close. Versions described here: Plumbline 1.1.
Research only, not investment advice. This page describes how the indicator works in plain English; it does not publish the source. All results shown are hypothetical.