Indicators · Pressure · seven-layer 0–100 build-up score
Seismic Score
Seismic Score adds up seven layers that tend to show pressure building before a big move and scores the total from 0 to 100, with a BULL, BEAR or NEUTRAL bias. It is built and calibrated for BTC on the 1-hour chart.
What it is
Each layer contributes points according to its weight, and the score is the total over the weight of the layers that currently have data, so a missing feed does not drag the scale down. Each active layer also votes bullish or bearish; the net vote becomes the bias. The score says how much pressure is building, not when or which way price will break. Three layers (open interest, funding and basis) read Binance perpetual-futures data, so they only work on crypto and show N/A on stocks.
Inputs and defaults
| Input | Default | What it does |
|---|---|---|
| RSI divergence | Weight 25 | RSI 14, pivots 4/2; price makes a new extreme that RSI does not confirm |
| OI–price divergence | Weight 20 · crypto only | 3-day change in Binance open interest vs the 3-day price change, each ranked against 180 days |
| Funding extreme | Weight 15 · crypto only | Estimated funding’s distance from the 0.01% baseline |
| ATR compression | Weight 15 | ATR 14 below 80% of its average (TIGHT at 80–90%) |
| Volume–price divergence | Weight 15 | A new 24-hour high or low on volume 30% below average |
| ADX trough and turn | Weight 10 | ADX below 25, then rising for 2 bars |
| Basis premium | Weight 10 · crypto only | USDT-margined perp (in dollars) vs the coin-margined perp, 0.03% threshold |
| Alert threshold | 34 | Score that turns columns red and triggers the alert |
Signals and rules
- Score levels: LOW under 10, MODERATE from 10, ELEVATED from 22, HIGH from the 34 threshold, and CRITICAL at the top band.
- Bias: bullish signals include a bullish RSI divergence, shorts piling in (OI up while price falls), capitulation (OI and price both down), crowded shorts on funding and a thin-volume new low. The mirror readings vote bearish. ATR compression adds pressure without a direction.
- Signals fade over a decay window instead of switching off at once.
- Windows are set in hours and rescale to the chart timeframe; on daily charts minimum bar counts keep each layer working.
- On 24/7 symbols, range and volume are compared with what that hour of the week (or day, on daily charts) normally does, so weekends do not read as coiled.
Reading the chart
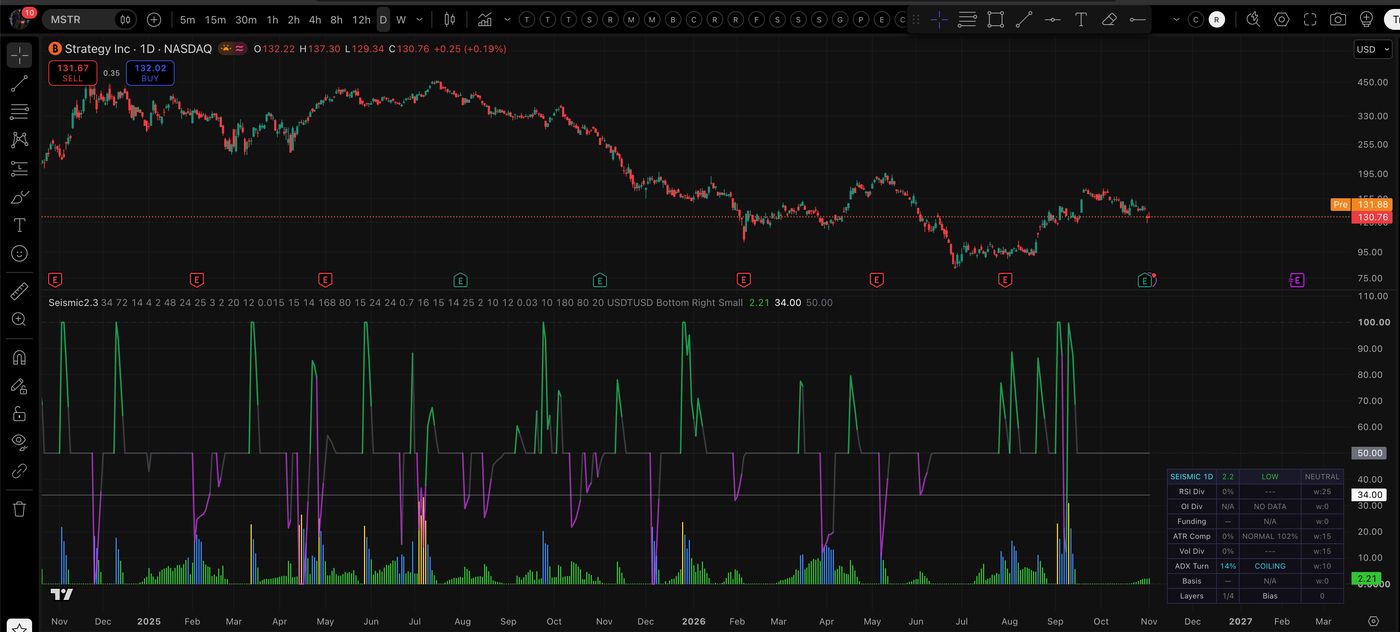
- Columns show the score: lime under 10, blue from 10, gold from 22, red from 34. A white line marks the threshold.
- At or above the threshold the background tints green (bullish), purple (bearish) or yellow (neutral), stronger as the score rises.
- The bias line is centered at 50: lime above, fuchsia below, gray near 50.
- The table lists each layer’s points, status and weight, plus the score, level, bias and how many layers are active.
Where it appears on MystTrades
Seismic readings feed the BTC structure page, where the score and its bias appear alongside the other Bitcoin positioning reads.
Tested results and limits
No Seismic chart table is published. The code is explicit that the direction each layer assigns is the design’s hypothesis and has not been tested against forward returns. The defaults are tuned for BTC on 1-hour bars; on stocks the three futures layers drop out.
Alerts
In TradingView open the alert dialog, set Condition to Seismic Score, pick the event you want from the list, and choose Once per bar close. Events are decided on the confirmed close; where an order is involved it fills at the next open.
- Seismic Score Alert: the score crosses up through the threshold (sends the ticker, score, bias, active layers and level).
- Bullish RSI Divergence and Bearish RSI Divergence.
Version
Seismic Score 2.3.
Nightly refresh and version
The site recomputes every read from end-of-day data each night after the close. Versions described here: Seismic Score 2.3.
Research only, not investment advice. This page describes how the indicator works in plain English; it does not publish the source. All results shown are hypothetical.