Indicators · Trend · EMA cloud switch with level ladder
Strata
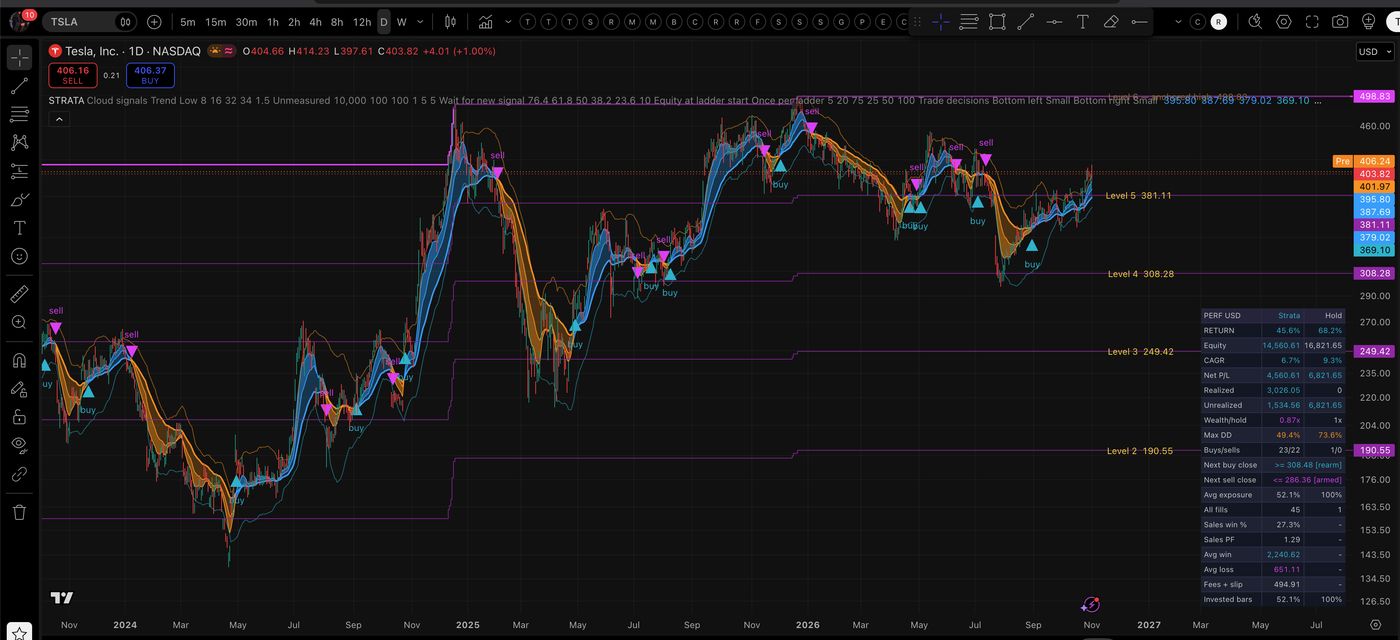
Strata is a three-EMA cloud that turns blue in an uptrend and orange in a downtrend. By default it buys when the cloud flips blue and sells when it flips orange, and it draws a ladder of levels hung from the highest high.
What it is
The cloud uses 8, 16 and 32-period EMAs of the close. Its noise filter is the standard deviation of price around the middle EMA over 34 bars, so it uses no Average True Range. The cloud is long or cash, never short, and decisions use the confirmed close with fills at the next open. A second, optional model buys and sells at ladder levels instead.
Inputs and defaults
| Input | Default | What it does |
|---|---|---|
| Trading model | Cloud signals | Or Level layering |
| Signal logic | Trend | Or Deviation (re-entry through a band) |
| EMAs | 8 / 16 / 32 | Fast, middle and slow |
| Noise suppression | Low (0.1σ) | Dead band the fast−slow gap must clear to change color |
| Deviation bands | 1.5σ over 34 bars | Used by Deviation logic |
| Ladder levels | 10, 23.6, 38.2, 50, 61.8, 76.4% of the high | Levels 0–5; level 6 is the anchored high |
| Sizing | 100% buy / 100% sell | Of available cash or held shares |
| Start / costs | Jan 1, 2021 · 5 bps + 5 bps | Waits for a fresh signal before the first buy |
Signals and rules
- Blue (uptrend): EMA8 − EMA32 is above 0.1σ. Orange (downtrend): it is below −0.1σ. Inside that band the color holds.
- Trend logic (default): buy on the flip from orange to blue, sell on the flip from blue to orange.
- Deviation logic: buy when the close crosses back up through the lower band, sell when it crosses back down through the upper band.
- Level layering (optional): buys 5%, 20% and 75% of ladder capital as the close falls through levels 5, 4 and 3, and sells 25%, 50% and 100% of shares as it climbs back through levels 4, 5 and the anchored high. A new high resets the ladder.
Reading the chart
- The ribbon between the three EMAs is blue, orange, or gray before it is measured.
- Aqua and orange lines are the deviation bands.
- Purple step lines are the ladder, labeled with prices on the right; the fuchsia line is the anchored high.
- Triangles mark trade decisions on the signal candle; the table shows return, drawdown and the next buy and sell close targets.
Where it appears on MystTrades
Strata’s trend flip is the buy trigger inside ShadowBook, so it shows up on the ShadowBook and crypto pages, and its readings are used on the trading pairs page.
Tested results and limits
No standalone Strata chart table is published here. The code describes itself as an original, guide-inspired version whose level percentages and cloud math are its own assumptions. Like any EMA switch it is late at turns and whipsaws in sideways markets.
Alerts
In TradingView open the alert dialog, set Condition to Strata, pick the event you want from the list, and choose Once per bar close. Events are decided on the confirmed close; where an order is involved it fills at the next open.
- Buy decision - next open and Sell decision - next open: a confirmed decision that the model fills at the next open.
- Raw buy signal and Raw sell signal: every raw signal across all history, whatever the holdings.
Version
Strata 0.13 (TheurgyLabs).
Nightly refresh and version
The site recomputes every read from end-of-day data each night after the close. Versions described here: Strata 0.13 (TheurgyLabs).
Research only, not investment advice. This page describes how the indicator works in plain English; it does not publish the source. All results shown are hypothetical.