Indicators · Trend · ATR cloud switch with level ladder
Terrace
Terrace is a simple all-in, all-out trend switch built on a cloud. A close above the top of the cloud turns it up, and a close below the bottom turns it down. Inside the cloud nothing changes.
What it is
The middle line is a smoothed average of the bar midpoint (high+low)/2. The cloud's edges are that line plus and minus one ATR. The cloud's width filters out noise: price has to clear the whole cloud before the regime flips, so small wiggles don't cause trades.
Inputs and defaults
| Input | Default | What it does |
|---|---|---|
| Middle type | SMMA (fixed) | Or Adaptive: efficiency-ratio speed from 20 (clean trend) to 200 (chop) |
| Source | hl2 | Bar midpoint |
| Middle length | 100 | |
| ATR length | 14 | |
| Noise | 1.0 ATR | Half-width of the cloud; bigger means fewer flips |
| Ladder fractions | 0.10, 0.236, 0.382, 0.5, 0.618, 0.764 | Of the highest high since the anchor |
| Costs | 5 + 5 bp per side | Commission and slippage |
| Fill | Next open |
Signals and rules
- Turns UP when a closed bar finishes above the top edge; turns DOWN when it finishes below the bottom edge. Anywhere inside, it keeps its state.
- UP after DOWN is a 100% buy; DOWN after UP is a 100% sell, filled at the next open.
- The ladder (purple steps) is Level 6, the highest high since the anchor date, plus Levels 0–5 as fractions of it. It's display only and never affects signals.
Reading the chart
- The cloud's color shows the regime (UP or DOWN); triangles mark buys and sells, and the first buy is the seed.
- The stepped ladder shows Levels 0–6 with price labels.
- The performance table compares Terrace with buy and hold.
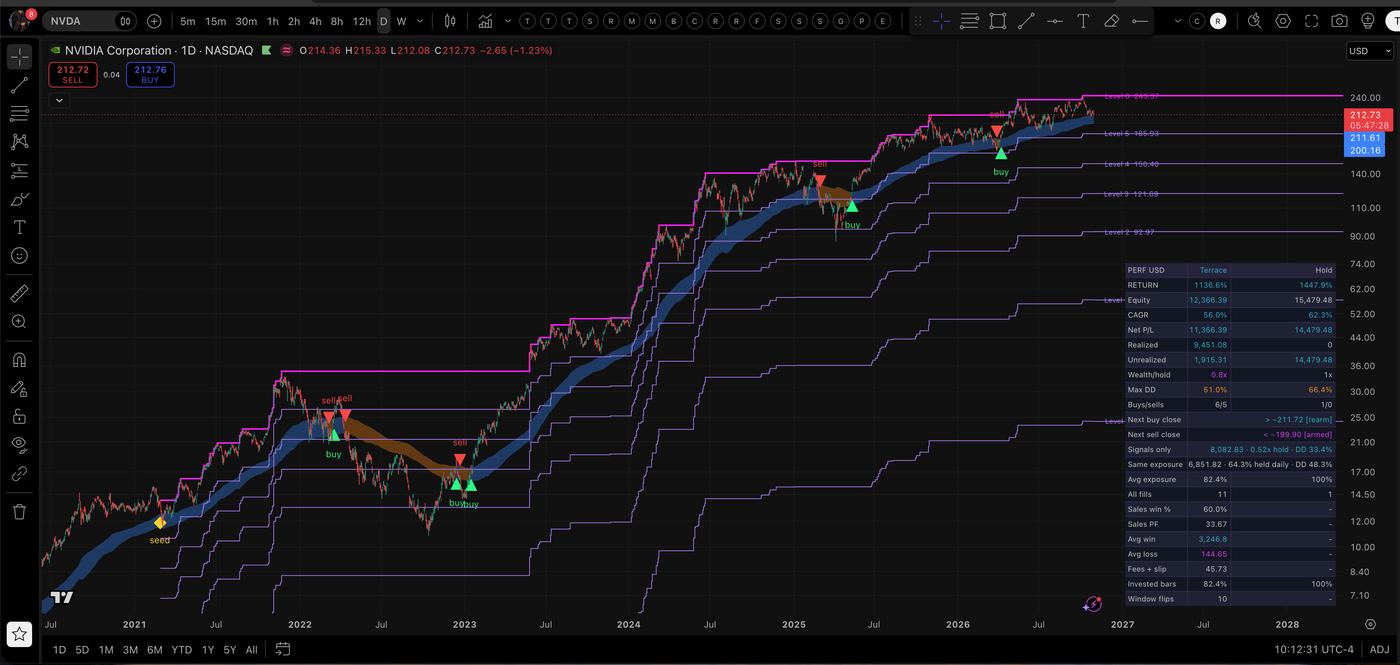
Levels and distance
On Daily reads, a stock in a DOWN regime shows "turns up above" at the cloud's top edge, and one in an UP regime shows "turns down below" at the bottom edge, with the % distance from the close. The edges move a little each day as the average and ATR update.
Where it appears on MystTrades
Terrace is the trend read on Daily reads (UP or DOWN, with days in the state) and on the home dashboard's Daily Reads card.
Tested results and limits
| Metric | Indicator | Buy & hold |
|---|---|---|
| Return | 1,138.6% | 1,447.9% |
| CAGR | 56.0% | 62.3% |
| Max drawdown | 51.0% | 66.4% |
| Buys / sells | 6 / 5 | 1 / 0 |
| Sales win rate | 60% | – |
| Profit factor | 33.67 | – |
Backtest figures are from the indicator's own table on an NVDA daily chart (Oct 29, 2026). They are hypothetical, include the script's cost assumptions, depend on the start date, and are not a forecast or advice.
It's a trend switch: expect lag at turns and some giveback before it exits.
Alerts
Set one alert per chart. In TradingView open the alert dialog, set Condition to Terrace, choose Any alert() function call, and pick Once per bar close if offered. That single alert covers every event below; you don’t need a separate alert for each signal. Events fire on the confirmed close and describe an action for the next open.
- Turns UP: a close above the cloud after a DOWN state (100% buy at the next open).
- Turns DOWN: a close below the cloud after an UP state (100% sell at the next open).
Version
Terrace 0.53.
Nightly refresh and version
The site recomputes every read from end-of-day data each night after the close. Versions described here: Terrace 0.53.
Research only, not investment advice. This page describes how the indicator works in plain English; it does not publish the source. All results shown are hypothetical.