Indicators · Mean reversion · WaveTrend reversals with flow
Theurgy Flow
Theurgy Flow is TheurgyLabs' layered oscillator. It uses standard WaveTrend math with a candle-pressure flow, and it marks reversals only when the wave turns after visiting an extreme zone.
What it is
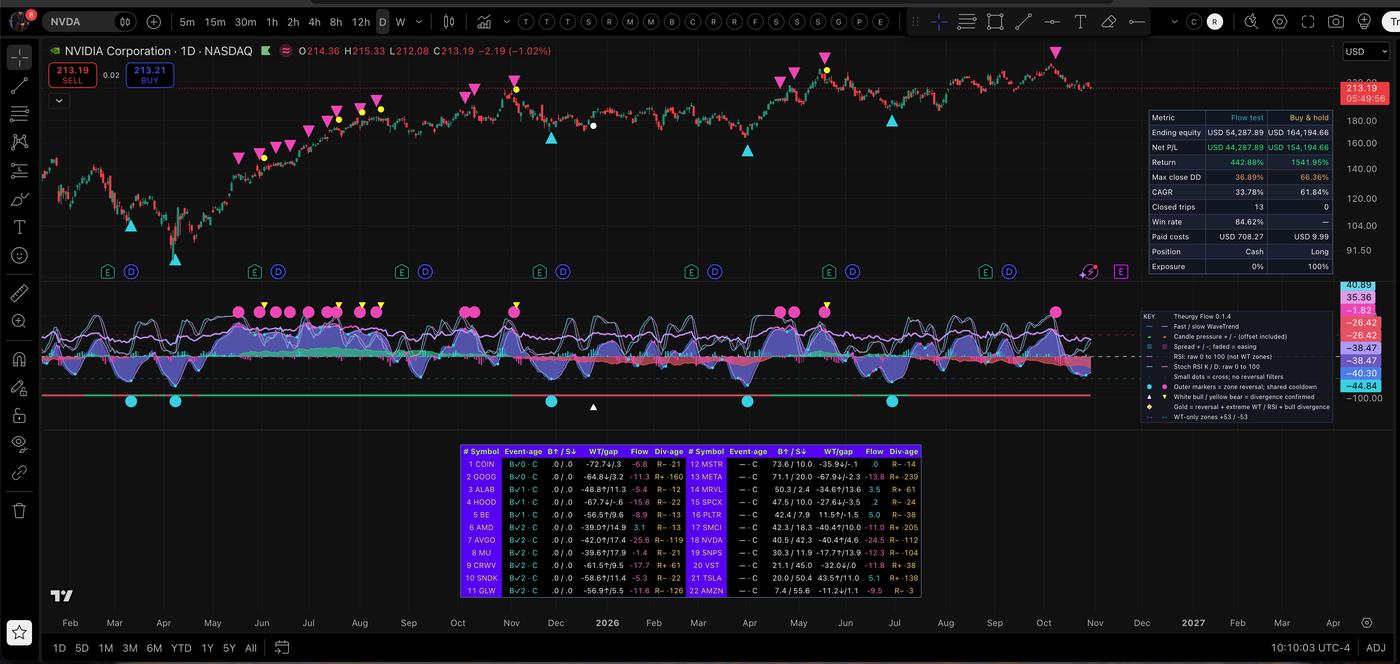
The pane (Theurgy Flow 0.1.4) has a fast and slow WaveTrend, a fast-wave histogram, a flow area, RSI and Stochastic RSI. Theurgy Flow A 0.1.5 puts the same markers on price and adds a long/cash performance test. TheurgyFlowScan 0.1.14 runs the same signals across 22 symbols in one table. It uses the public WaveTrend formula; it is not Market Cipher and doesn't reproduce its signals.
Inputs and defaults
| Input | Default | What it does |
|---|---|---|
| Wave source | HLC3 | |
| Channel / average / signal | 9 / 12 / 3 | WaveTrend lengths |
| Oversold / overbought | −53 / +53 | Reversal zones |
| Extreme zone | ±75 | Used for gold recoveries |
| Flow | Candle pressure, 60 bars, offset −2.5 | Candle body vs range; Volume MFI optional |
| RSI / Stoch RSI | 14, 30/70 · 14, 3, 3 | |
| Recent-zone memory | 3 bars | How recently the wave must have been in the zone |
| Reversal cooldown | 3 bars | Shared by both directions |
| Gold divergence memory / RSI | 12 bars / ≤ 35 | |
| Divergence pivots | 2 left / 2 right, 5–80 bars apart, zone ±45 | Regular on, hidden off |
| HTF confirmation | Off | Optional, uses the last closed higher-timeframe bar |
Signals and rules
- Bullish reversal: the fast wave crosses above the signal line after visiting the oversold zone (−53) within the last 3 bars, outside the 3-bar cooldown.
- Bearish reversal: the mirror image at +53.
- Gold recovery: a bullish reversal that also had an extreme wave (−75), RSI at or below 35, and a confirmed regular bullish divergence within 12 bars.
- Divergences compare price at wave pivots and are only known after the right-hand pivot bars close, so they print a couple of bars late, on the confirmation bar.
- Small cross dots are unfiltered wave crosses. Everything waits for the bar to close.
Reading the chart
- Cyan (bullish) and magenta (bearish) markers: zone-qualified reversals; a distinct gold marker for gold recoveries.
- Divergence labels on confirmed divergences.
- Flow area and strip: candle pressure above or below zero. The overlay key and the flow-test table sit on the price chart.
- The scan table lists each symbol's last event and age, buy/sell readiness, wave and gap, flow and divergence age.
Where it appears on MystTrades
Theurgy Flow is the TFLOW column on the 22-stock scan (lean, last event, buy- and sell-readiness).
Tested results and limits
| Flow test, NVDA daily | Flow test | Buy & hold |
|---|---|---|
| Return | 442.9% | 1,541.9% |
| CAGR | 33.8% | 61.8% |
| Max close drawdown | 36.9% | 66.4% |
| Closed trips | 13 | – |
| Win rate | 84.6% | – |
Backtest figures are from the indicator's own table on an NVDA daily chart (Oct 29, 2026). They are hypothetical, include the script's cost assumptions, depend on the start date, and are not a forecast or advice.
It's a swing tool: it sits in cash between trips, so it cuts drawdown but lags buy and hold badly in a long uptrend like NVDA's.
Alerts
Set one alert per chart. In TradingView open the alert dialog, set Condition to Theurgy Flow, choose Any alert() function call, and pick Once per bar close if offered. That single alert covers every event below; you don’t need a separate alert for each signal. Events fire on the confirmed close and describe an action for the next open.
- Bullish reversal and bearish reversal.
- Gold recovery.
- Bull / bear divergence on its confirmation bar.
Version
Pane 0.1.4, overlay 0.1.5 and scan 0.1.14, all on shared core 0.1.0.
Nightly refresh and version
The site recomputes every read from end-of-day data each night after the close. Versions described here: Theurgy Flow 0.1.4 · Theurgy Flow A 0.1.5 · TheurgyFlowScan 0.1.14.
Research only, not investment advice. This page describes how the indicator works in plain English; it does not publish the source. All results shown are hypothetical.