Indicators · Trend · DMI/ADX entries, EMA-confirmed exits
TriEMA
TriEMA is a long-or-flat trend switch. It buys when buyers lead and trend strength is turning up, and it sells only when strength fades, sellers lead and price loses its fast average, all three at once.
What it is
TriEMA combines Wilder's directional movement (+DI, −DI and ADX) with a stack of three EMAs (18, 48 and 78). The DMI decides when to get in and out; the EMAs confirm exits and tell it when a choppy entry has become a real trend. It runs on daily bars and is long or flat, never short.
Inputs and defaults
| Input | Default | What it does |
|---|---|---|
| DI length / ADX smoothing | 24 / 24 | Directional movement lookback |
| EMAs | 18 / 48 / 78 | Fast, middle and slow trend averages |
| ADX floor | 15 | ADX must be above this for a normal entry |
| Learned ADX low | 25th percentile of last 200 | The ADX 'valley' that arms a second kind of entry |
| Chop entry size | 30% | Part-size buy when the market is choppy |
| Leverage step | Off | Optional |
Signals and rules
- Buy (when flat): +DI above −DI, ADX higher than the prior bar, and either ADX above 15 or ADX turning up from its learned low (touched within the last 3 bars).
- Sell (when long): ADX falling, −DI above +DI, and the close below the 18 EMA. All three are required, so it holds through ordinary pullbacks.
- Chop sizing: chop means the EMA gap (in ATRs) is below its learned 25th percentile and there were 4 or more DI crosses in 40 bars. A buy in chop is a 30% part buy; the rest is added when the EMAs stack 18 > 48 > 78.
- Decisions use the confirmed daily close.
Reading the chart
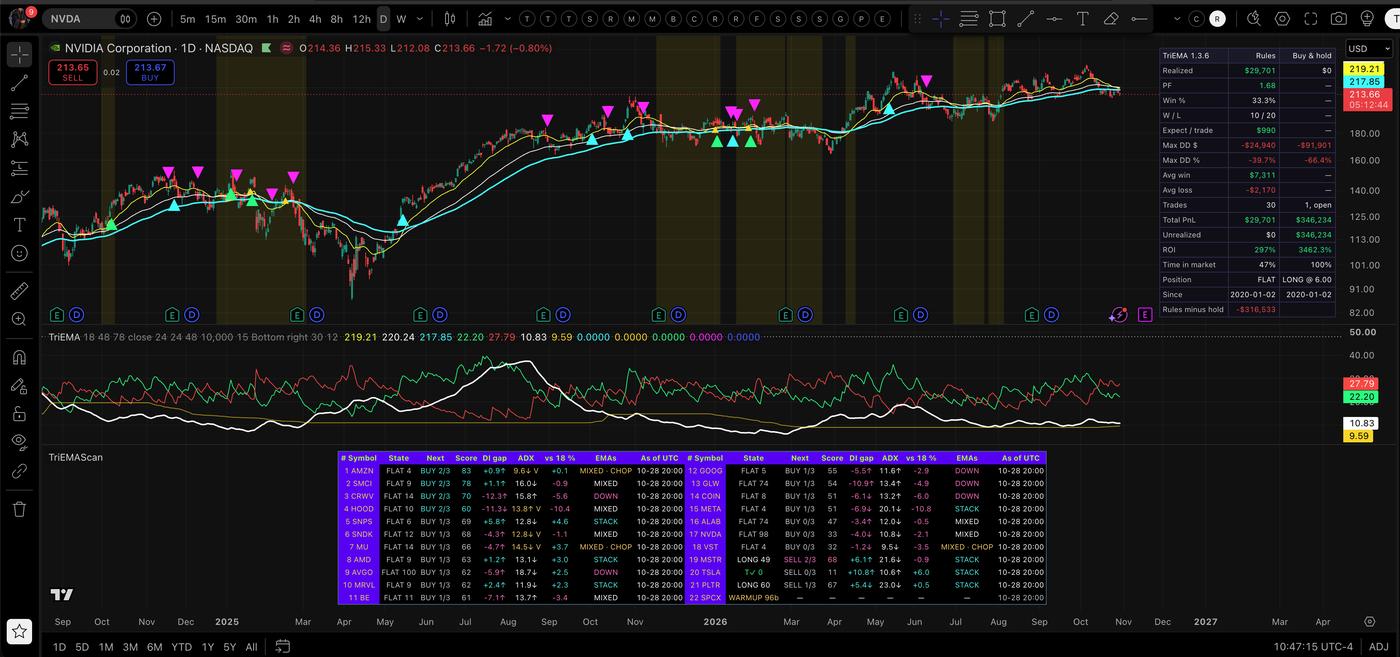
- Triangles mark full entries, part-size chop entries, the top-up when the EMAs stack, and exits.
- The three EMAs are drawn on price, and the chop state is shaded.
Where it appears on MystTrades
TriEMA is the trend column on the 22-stock scan. Each row shows the state, a 0–100 nearness score, and "BUY x/3" counting how many of the three buy legs are met. A blue bar on the scan tiles means TriEMA is holding a long.
Tested results and limits
No TriEMA chart table is published yet. Like every trend switch it is late at turns and gives back some gain before it exits.
Alerts
Set one alert per chart. In TradingView open the alert dialog, set Condition to TriEMA, choose Any alert() function call, and pick Once per bar close if offered. That single alert covers every event below; you don’t need a separate alert for each signal. Events fire on the confirmed close and describe an action for the next open.
- Buy: the DMI/ADX entry fires while flat (a part buy if the market is in chop).
- Add: the rest of a chop part buy once the EMAs stack 18 > 48 > 78.
- Sell: the full exit (ADX falling, −DI on top, close below the 18 EMA).
Version
TriEMA 1.3.7; the scan uses TriEMA Scan 0.1.1.
Nightly refresh and version
The site recomputes every read from end-of-day data each night after the close. Versions described here: TriEMA 1.3.7 · TriEMA Scan 0.1.1.
Research only, not investment advice. This page describes how the indicator works in plain English; it does not publish the source. All results shown are hypothetical.